Tag GraphTM
(A Structured Data Platform for Process Design Information)
Tag Graph TM Viewer

A New Paradigm for P&IDs — Connected and Discoverable
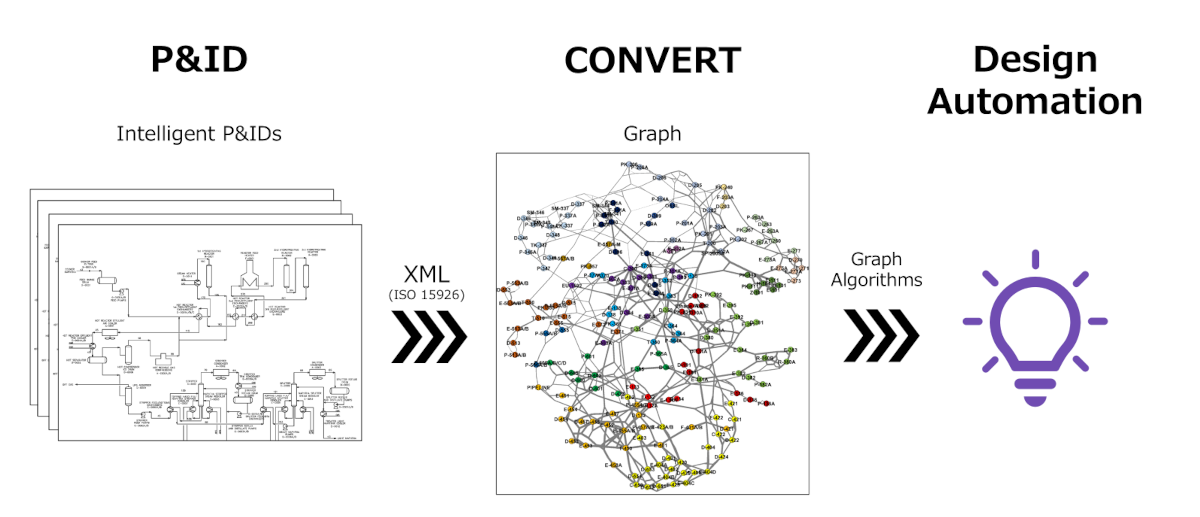
Tag GraphTM Viewer models P&IDs as graph structures, enabling efficient design validation and streamlining related engineering workflows.
- *This system has been developed exclusively for internal use and is not commercially available.
Traditionally, reviewing P&IDs (Piping and Instrumentation Diagrams) in plant engineering required engineers to manually examine a vast number of drawings. This process was time consuming, labor intensive, and prone to human error, making it difficult to ensure the data quality needed for downstream engineering automation.
To address these challenges, JGC developed Tag GraphTM Viewer, a system that dramatically improves the efficiency of P&ID verification. By modeling P&IDs as graph structures and leveraging graph theory, the system accelerates and automates various design verification tasks. As a result, markup and data aggregation work is significantly streamlined, while enhancing the quality and reliability of engineering data.
From Drawings to Data
Tag GraphTM Viewer transforms P&IDs from static drawings into machine processable graph data. By utilizing this structured dataset, engineers can rapidly and accurately perform tasks that were previously difficult or impractical with manual methods—such as design requirement checks or identifying lines subject to piping stress analysis.
Key Benefits of Tag GraphTM Viewer
- Significant Reduction in Markup and Aggregation Work
- Automates numerous manual verification tasks, achieving substantial time savings.
- Faster and More Accurate Design Requirement Checks
- Engineers can easily search for items under various conditions to validate design requirements.
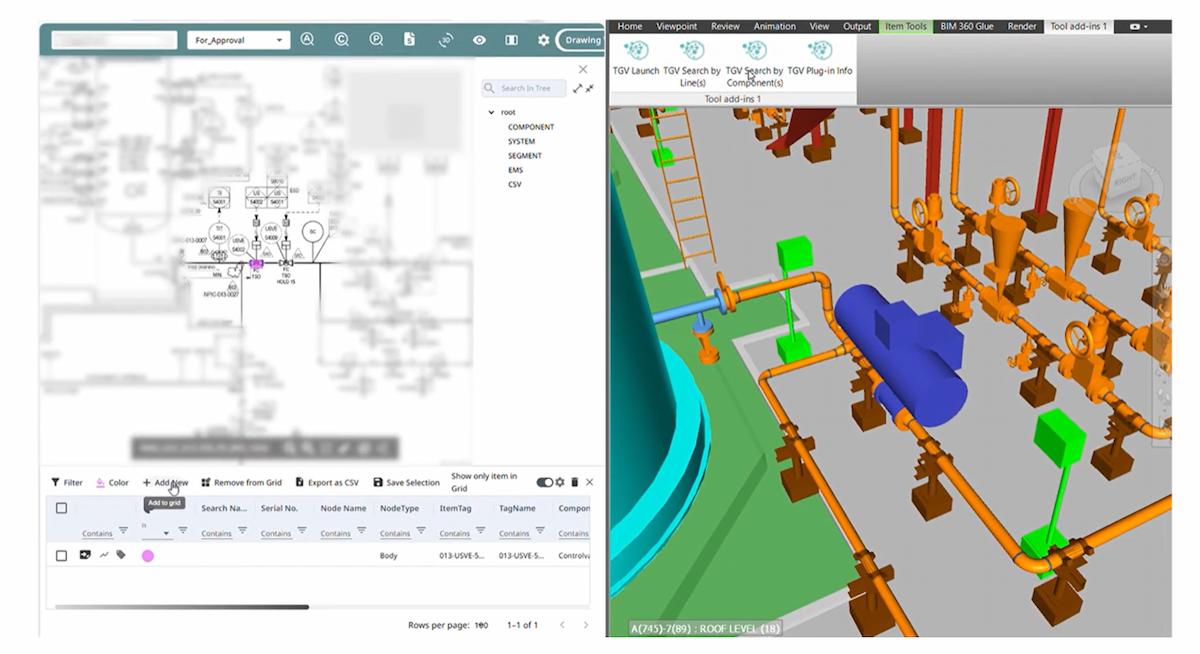
- Seamless navigation between P&IDs and 3D models makes it easy to confirm whether requirements are properly reflected in the layout.
- Automation of Tasks such as Identifying Stress Analysis Targets or Instrument Loop Classification
- Processes that previously required weeks or months of manual work can now be handled accurately in a short time.
- Enhanced Data Quality Supporting Downstream Automation
- Provides highly reliable engineering data, driving digital transformation (DX) across the entire design workflow.
From Data Utilization to Value Creation
The "From Drawings to Data" initiative enabled by Tag GraphTM Viewer is evolving further. The next step is Tag GraphTM Editor — a new approach to process design.
Under the concept of "P&IDs in three days," Tag GraphTM Editor aims to dramatically accelerate the generation of P&IDs. This enables rapid exploration of design alternatives together with clients during early phases such as Feasibility Studies and FEED, leading to higher project quality and reduced risk.
In addition, we are considering integration between Tag GraphTM Editor and our in house developed tool, Auto Plot PATHFINDER® (automated plot plan design system). This synergy will significantly enhance engineering efficiency throughout the entire project lifecycle, optimizing quality, cost, and schedule.
This system represents one of JGC Group's Engineering DX initiatives under ITGP2030. We will continue striving to deliver optimal plant solutions to our clients through advanced digital engineering technologies.
Energy Transition - EPC Technologies
- JGC GROUP'S MODULAR CONSTRUCTION METHOD
- AIRLIZE LNG®
- HARview®
- MixGen®
- LNG Cube
- J-AOS (JGC Air-cooled Heat Exchanger Optimization System)
- FieldOpt (Project Management System Using Wireless Devices)
- Auto Plot PATHFINDER® (Automated Plot Plan Design System)
- Tag Graph TM(A Structured Data Platform for Process Design Information)
- AWP (Advanced Work Packaging)